The last two weeks have been unrecognizable as typical trading sessions. Volatility measured by the CBOE Volatility Index (VIX) has picked up as yields on the bonds have also picked up to levels not seen since last summer. That has led the market’s trading sessions to have ever wider trading ranges compared to the typical summer. Let’s take a look at some of the data and ask a few questions to why this might be occurring.
First, take a look at the chart below of the summer trading ranges on a daily basis. To keep things simple we have defined a summer session as June through August. As you can see by the chart below, the bull run of the late 1990s leading up to the dot com bust had high daily trading range averages. Through the first few weeks of June, we are approaching levels we have not seen since 2000. That said, also note that the first few weeks of trading this June have seen the index close near the highs or lows everyday. This could mean there is a great divide between the bulls and bears as both the bulls and bears have closed the index at its respective highs and lows during the session. Who will win the tug of war is still in question at these near record index levels.

Another interesting point to make is the summer trading ranges have typically followed the VIX (see chart below). If you take a closer look at these two charts together (which I would have overlaid, but I had a lot of trouble doing that), you will notice the spikes in VIX coordinate with the higher trading ranges, except for this summer. From 1998-2002, summer trading range averages were all above 17 points. Coincidentally, VIX held above 20 (except for a few dips below) from 1998-2002. VIX has spiked above 20 only once since then and has been hovering in the low teens for most of the past three years.
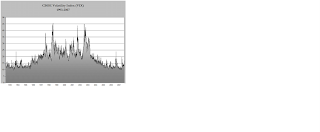
By analyzing the past 13 years of summer trading ranges and the corresponding VIX index, we see the correlation between the two is quite substantial. So why the dichotomy this summer? Well, it could be that we are in the beginning of the summer and the VIX hasn’t picked up the pace but could trend higher throughout the summer leaving the correlation intact. Or we could have an anomaly on our hands with lower VIX readings (below 20) and higher daily trading ranges (above 15). This could be a new trend where we begin to see this happen more and more often in the forthcoming years. Markets and traders can use historical figures as a standard, yet that is not to say the future will hold the same characteristics of the past or to put it in the all to often said phrase “past performance is not indicative of future results”.
The S&P 500 has looked a little “toppy” yet the bulls have not caved and continue to buy each dip as if it were the only opportunity to catch a ride. Most likely, if the higher trading ranges were to continue at these elevated levels VIX would pick up and the trading ranges will tend to be biased toward the downside (mostly because VIX and the market move inversely). These are some interesting markets and we will continue to spot these small nuances. Keep an eye on the summer movements as we could have a more productive summer in terms of trading opportunities than the past few years.


No comments:
Post a Comment